


GrapeTree
Introduction
GrapeTree builds graphs through the "Minimum Spanning Tree" (MSTree) or "Neighbor Joining" (NJ) algorithms, starting from the samples' allelic profiles, obtained from cgMLST.
Cohesive enables both tree calculatation and visualization, thanks to the integration of the standalone version of GrapeTree's interacitve visualization system.
A full guide to GrapeTree's visualization system interface and its usage is available at the GrapeTree dashboard guide page.
For more information on the software, please refer to the research article and to the official documentation of the EnteroBase system, to which GrapeTree belongs.

Run Analysis GrapeTree
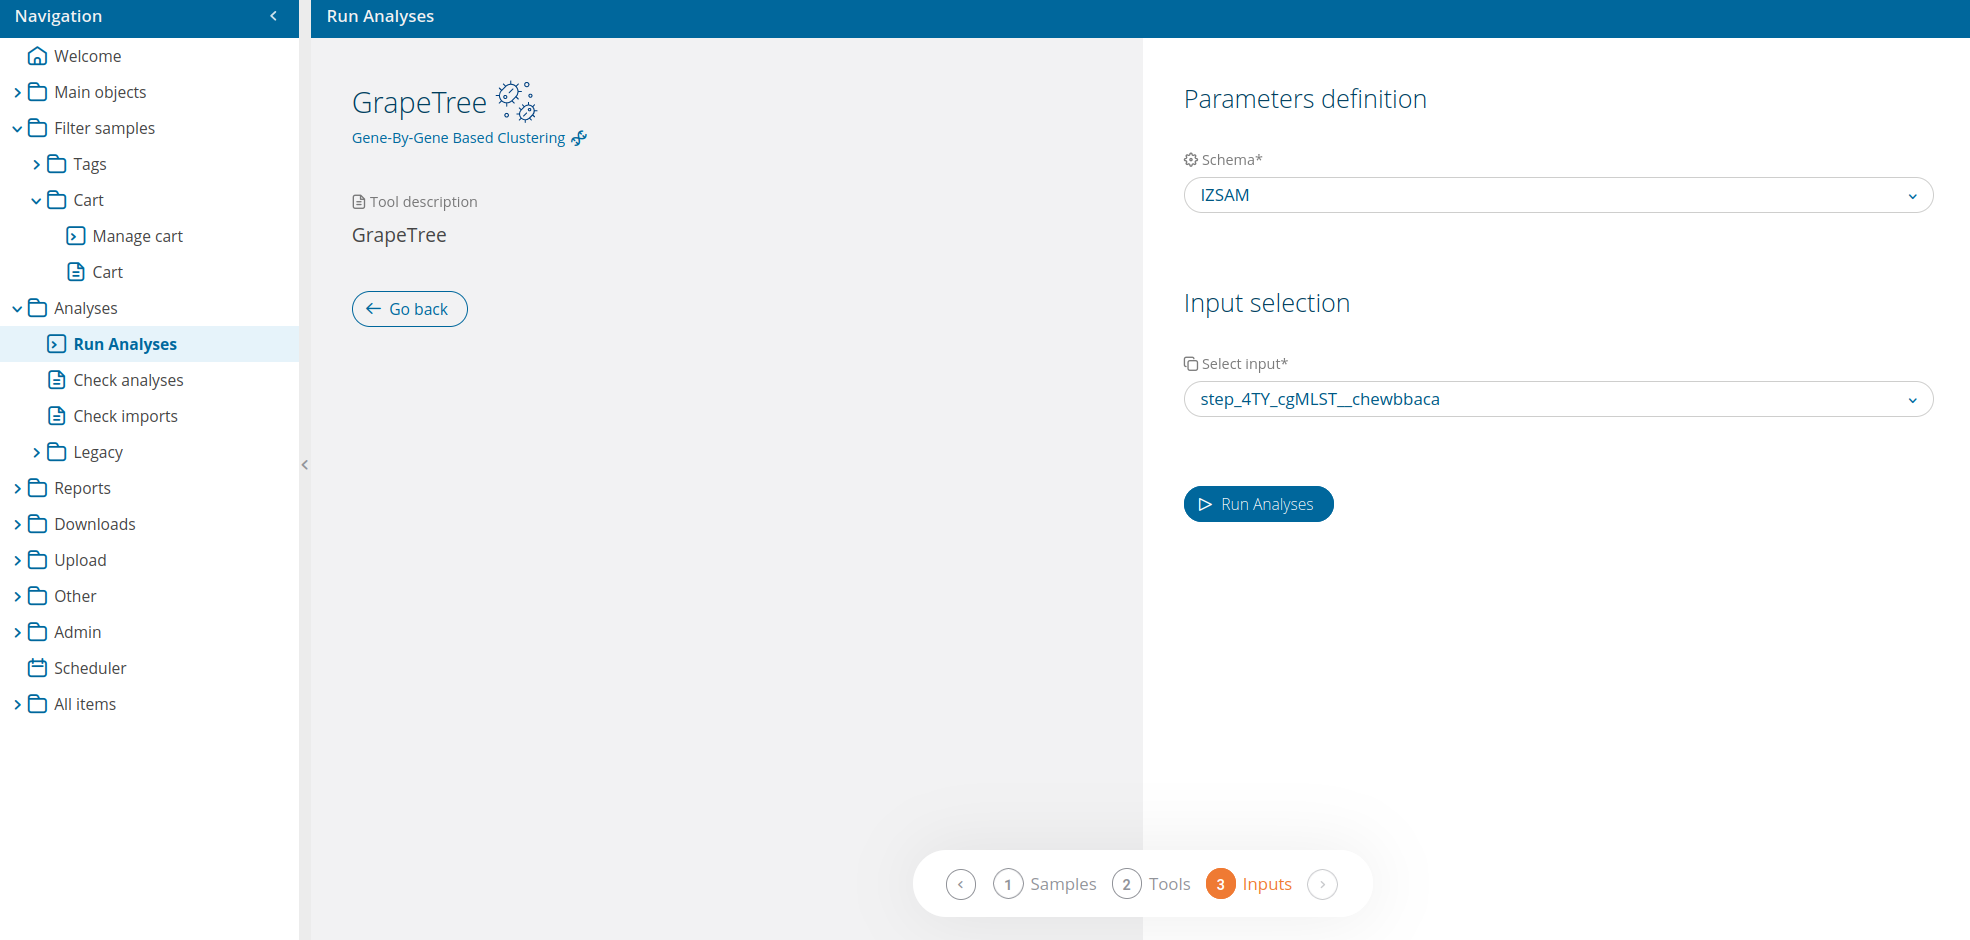
The analysis GrapeTree can be selected from the run analyses page.
The input selection UI delivers an advanced input selection mode, to allow selection of all types of supported input files at once.
Accepted inputs are:
- step_4TY_wgMLST
- step_4TY_cgMLST
For all possible inputs, is imperative that the program used to calculate allelic profiles is chewBBACA, so please mind the selected software, when launching 4TY_cgMLST or 4TY_wgMLST, if you wish to run GrapeTree later on.
It will be necessary to specify the 4TY_cgMLST__chewbbaca schema for the appropriate species (selection available in the parameter section), if the selected input consists of cgMLST allelic profiles. The field is pre-filled with the most appropriate schema for the microorganism matching the codes of samples in the cart or tag used for requesting the analysis.
A link to Check analysis will be created after launching the requested analysis. The system will notify the user after a succesful analysis launch and once execution has ended.
The analysis summary lists the output directory and additional options, such as access to some of the output files and direct graph visualization (both MSTree and NJ graphs) thanks to GrapeTree's integration in Cohesive.
Output directory
Please refer to Cohesive's specific Wiki page for information on file download.
The output directory is available at the link in the download page or at the link in the analysis' summary card. The results directory is located directly in the root directory. Inside results there are 2 subdirectories:
- meta: ("metadata") contains log and configuration files.
- result: contains the analysis' output files.
The following table lists output files stored in results.
| File | Description | Location |
|---|---|---|
| cgMLST.nwk | nwk (newick) treefile obtained with MSTree algorithm | results directory |
| cgMLST.tsv | tsv table with alleles identified by chewBBACA during cgMLST. Rows: samples; Columns: loci. | results directory |
| cgMLST_NJ.nwk | nwk (newick) treefile obtained with NJ algorithm | results directory |
| missing_loci.tsv | list of loci not shared between samples, thus discarded because uninformative for tree construction | results directory |
nwk files contain all of the tree's data and can be visualized through GrapeTree or an external tree-graph visualization software.
